Volatility is often associated with defining risk. Yet, when it comes to investing in the stock market, volatility is more frequently associated with financial loss. This uncertainty can result in a significant source of anxiety for investors, especially when the investments being affected by volatility are retirement savings.
By nature, we all want to avoid experiencing a financial loss. Everyone seems to enjoy the benefits that come from the upside of volatility, (namely, gains in their investment portfolios or retirement accounts) but fear the other side of the curve. What is important to note here, however, is that investors cannot have one without the other – substantial gains cannot be expected without assuming substantial amounts of volatility. But, volatility is an unavoidable and ever-present force – the stock market always has and always will fluctuate. Fortunately for investors, there is a simple remedy for volatility, and this remedy is time.
With time being the natural antidote for market volatility, you may now be wondering “How much time?” We will dive into this concept deeper in next month’s article. For now, let’s keep it simple and say that longer periods of time will be what cools the effects of strong market volatility – think of time being at least ten years. Therefore, long-term investors will be the ones to benefit the most.
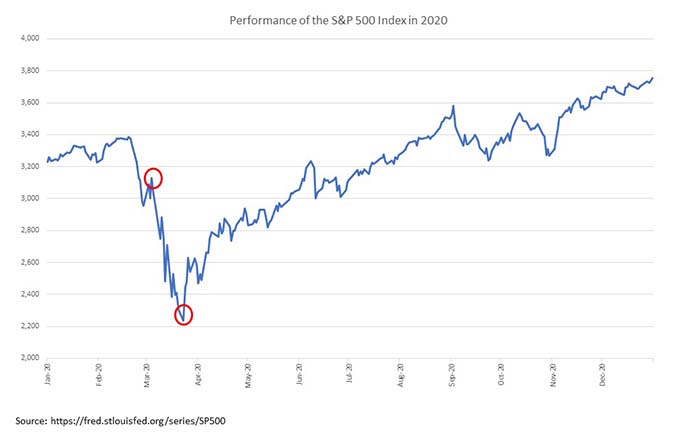
To better understand the benefits of a long-term investing timeline, consider the chart below from the S&P 500 Index. The significant drop over one month noted below was a severe decline of 34% with the onset of COVID-19. This would suit almost every investor’s definition of volatility. However, viewing this S&P chart – from January 1, 2020, through December 31, 2020, a period of only one year, one sees a positive result. Seen through the lens of a short-term investor this would have been perceived as a volatile investment period with a high degree of risk. Quite the opposite for those with a slightly longer time horizon.

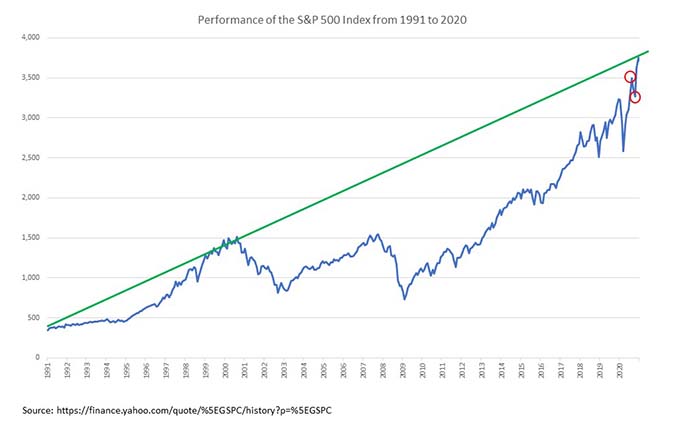
For long-term investors, however, the chart below showcases a better perspective on what this “volatility” actually looks like over a still longer period of time. This is a 30-year chart of the S&P 500 versus the 1-year chart above. There were several events during this period when equity investments were deemed by many financial advisors to be “too risky” due to rapid downward market fluctuations: the 1997 Asian currency crisis, the 2000 tech bubble, the 2008 Great Recession, and most recently the COVID-19 pandemic. However, long-term investors were rewarded after each of these events with higher stock market valuations.

Investors who choose to minimize short-term volatility typically do so by investing a portion of their funds in bonds or money markets. While these securities can reduce risk, they do so with historically lower returns. This “cost of caution” may reduce short-term volatility, but it is at the substantial cost of long-term performance. We will explore these costs in greater detail in subsequent articles.
So, instead of asking yourself “how much risk do you want to take?” ask yourself “how much are you willing to pay to reduce short-term volatility when your actual time horizon is longer – a year, five years, a decade, or more?”
Join us next month for part IV of our series, where we define “long-term,” and talk more about time and the power of compounding.


